With the recent debates on the Democratic side I have seen people discussion political ideology as a spectrum with some people on the left and some people on the right. I wanted to write a short detail on reasons that doesn’t hold up to statistical scrutiny.
Premise
To start, here is what people generally presume. There is an idea that there is a broad spectrum of political ideology and that everyone will fall somewhere on the left or right side of the spectrum. That looks something like this.
set.seed(2019)  # For replicability
n_per_party <- 1000
political_m <- .75
pol_cols <- c('blue', 'tan', 'red')

## Build some simulated data
individuals <- bind_rows(
  # Democrats
  data.frame(party = 'Democrats',
             political_score = rnorm(n = n_per_party, mean = -1 * political_m)),
  # Republicans
  data.frame(party = 'Republicans',
             political_score = rnorm(n = n_per_party, mean = +1 * political_m)),
  # Independents
  data.frame(party = 'Independents',
             political_score = rnorm(n = n_per_party, mean = 0))
  ) %>%
  mutate(party = factor(party, levels = c('Democrats', 'Independents', 'Republicans')))
So we can see how things look overall…
ggplot(individuals, aes(x = political_score)) +
  geom_density(colour = 'gray50', fill = 'gray70', alpha = 1/5) +
  scale_y_continuous(limits = c(0, .50)) +
  labs(x = 'Political Ideology')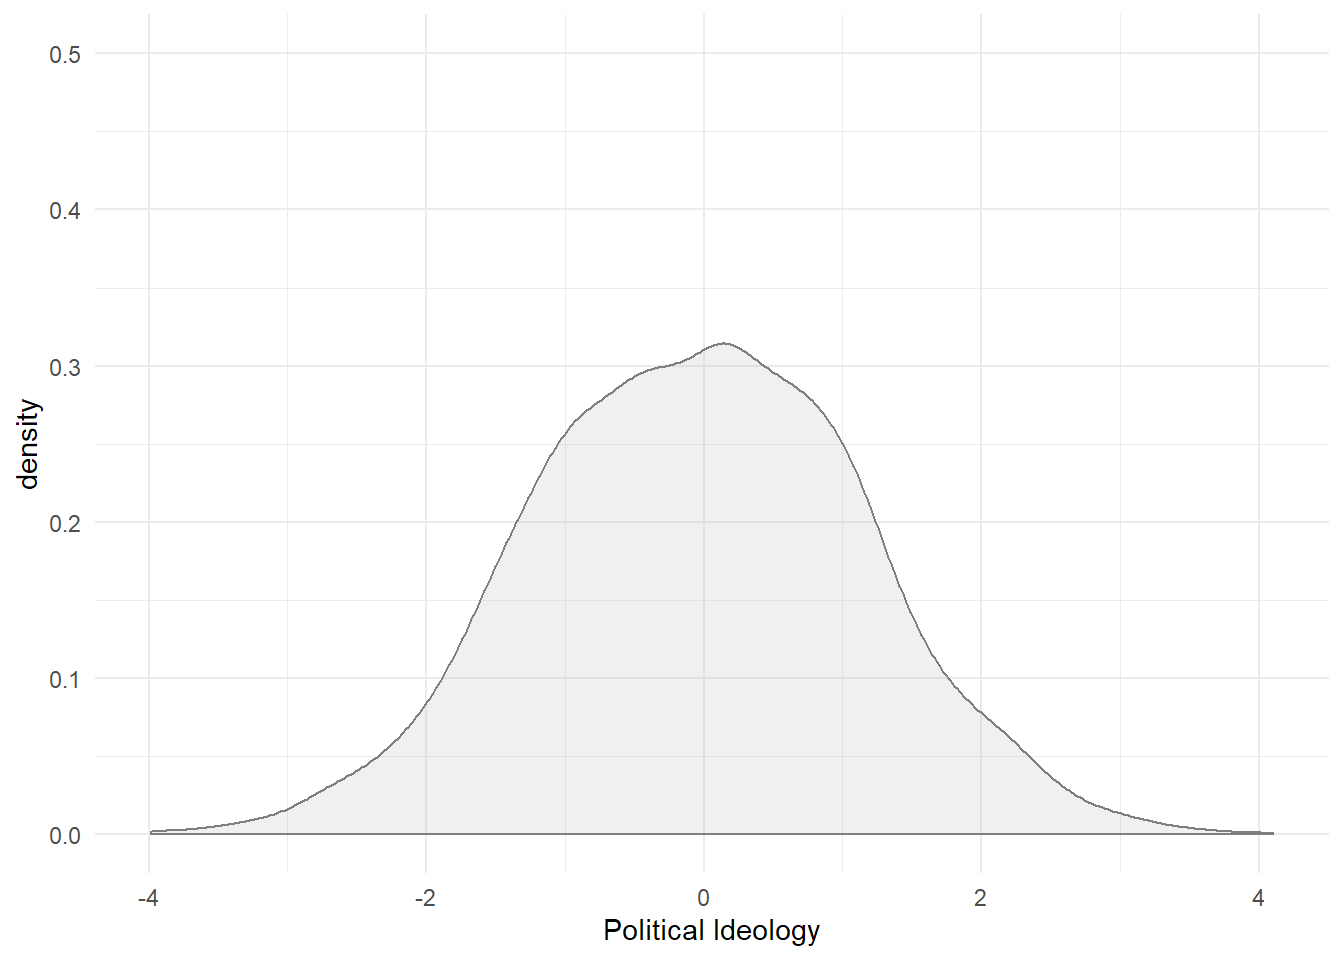
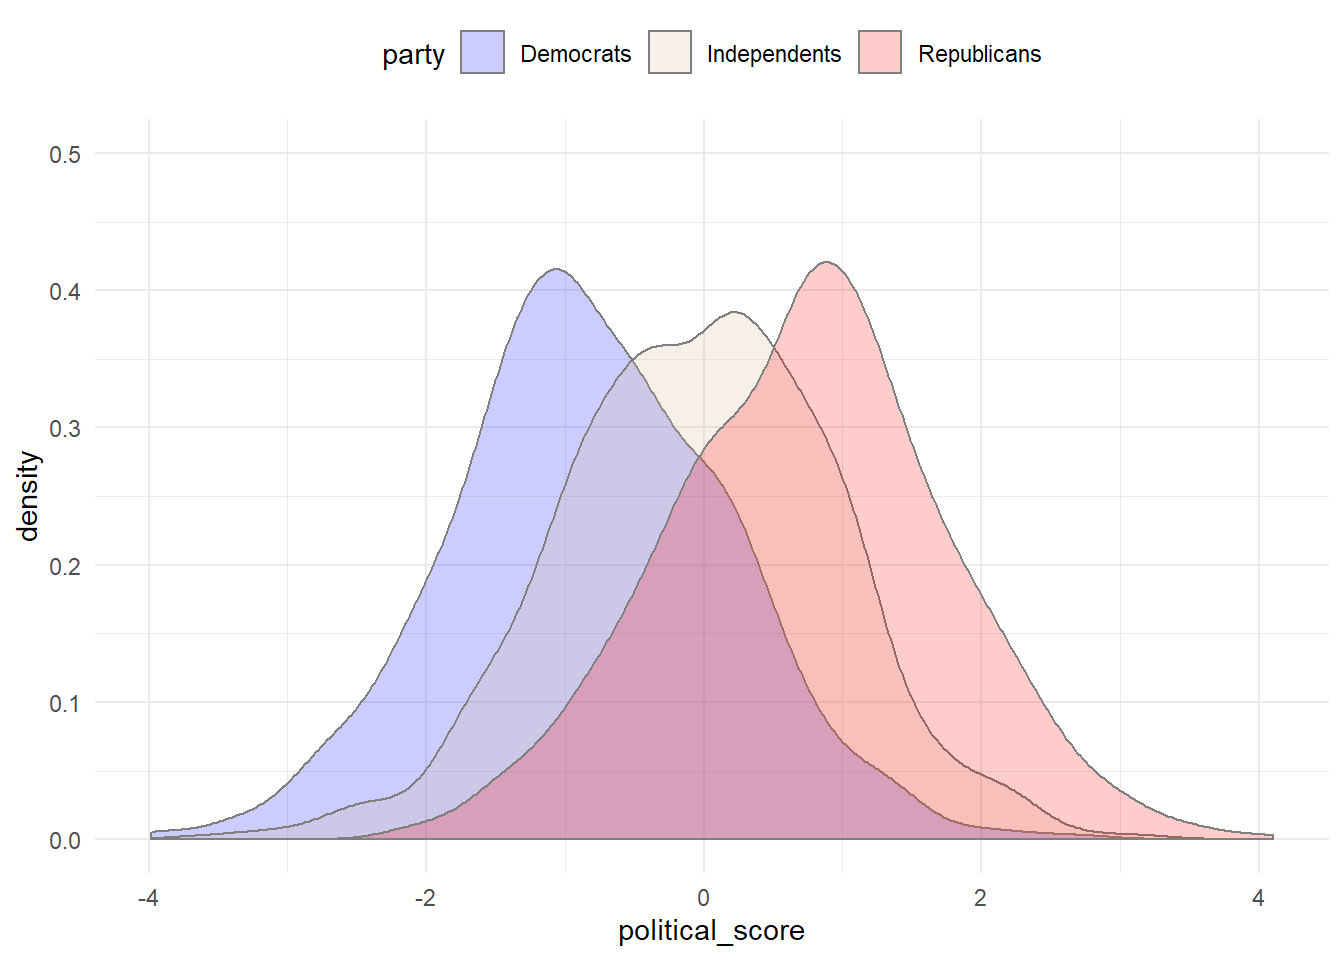
And when we break it down by political ideology.
ggplot(individuals, aes(x = political_score, fill = party)) +
  geom_density(colour = 'gray50', alpha = 1/5) +
  scale_fill_manual(values = pol_cols) +
  scale_y_continuous(limits = c(0, .50)) +
  theme(legend.position = 'top')